Datalab Faculty
Jessica HullmanProject Description
Visualizations are often used to communicate about data, for example in the media where interactive graphics are designed to supplement text articles, and in communicating analysis in research and industry settings. Presentation order, annotation, and consistency in the design of multiple visualizations are just a few considerations that impact communication-oriented visualization.
Most visualization tools, however, focus on supporting analysis. One aim of research in this area is to develop better tools for automatically and semi-automatically constructing such visualizations. For example, how can we develop semi-automated algorithms that help suggest good presentation orders and designs to a narrative visualization designer? Can we automatically construct annotated visualizations to make it easier for news and other organizations to generate visualizations to contextualize text articles?
Publications
- A Deeper Understanding of Sequence in Narrative Visualization
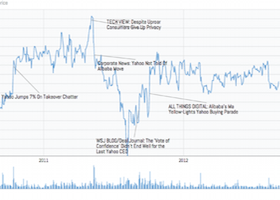
- Contextifier: Automatic Generation of Annotated Stock Visualizations
- NewsViews: An Automated Pipeline for Creating Custom Geovisualizations ...
- Visualization Rhetoric: Framing Effects in Narrative Visualization
- Content, Context, & Critique: Commenting on a Visualization-Oriented News Blog
- Evaluating Visualization Sets: Trade-offs Between Local Effectiveness and Global Consistency